How do I know if my machine learning results are any good?

Comments
-
"Good" is a very relative term. It all really depends on your use case and the kind of data you are trying to predict.
For example, if you were predicting whether customers would cancel a subscription service (we'll refer to this as churning going forward), you hopefully would have a dataset where in a given month only 1% or 2% of the customer base did churn. If this is the case then a model that guessed that no one ever churns would have a accuracy rating of 99%!!! A truly amazing number, and an even more amazing model, because it told you nothing more than you knew before.
So in this case the "accuracy" measure is not the right one to look at. (In this case. I would recommend looking at Decile 1 Lift, AOC, ROC, or F1)
The tool would automatically choose a measure called area under the curve if such a data was provided to it
you can find this information here:
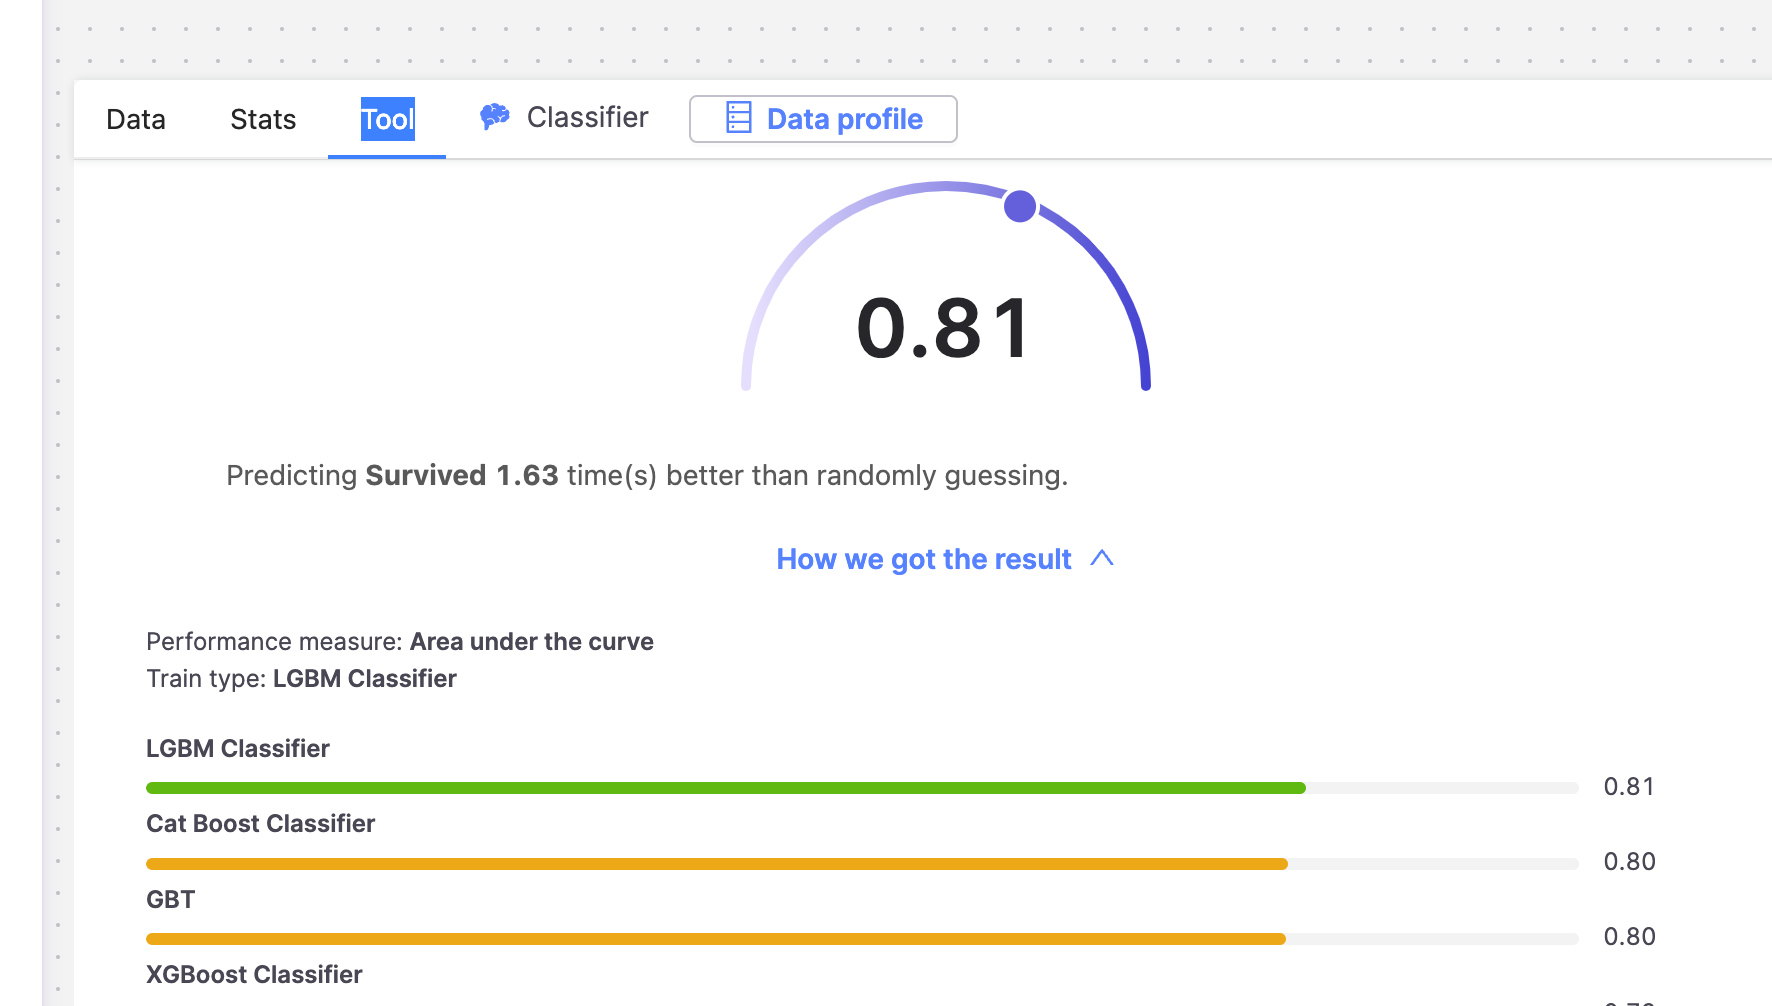
I won't explain exactly what "area under the curve" means, but i'll explain a lift metric to give you an analogy.
Let's say that we had this population, where every month 1% canceled. Then if we were to pick a random 10% of the population we expect that 1% of that 10% would cancel. (assuming a large enough dataset)
If however, we then organized the population by the model probability of canceling and looked at the top 10% of the population by this sorting, we may find that 3% of those people canceled. Just because the model said they were likely to cancel does not mean they would, but it does mean they were more likely.
In this case 3 times more likely. So here you can interpret your model to be 3 times more powerful at identifying churners than randomly guessing who will churn.
It's of course also very important what your use case is and how you plan to use your information.
The underlying data button actually has some very good information to help you understand this.
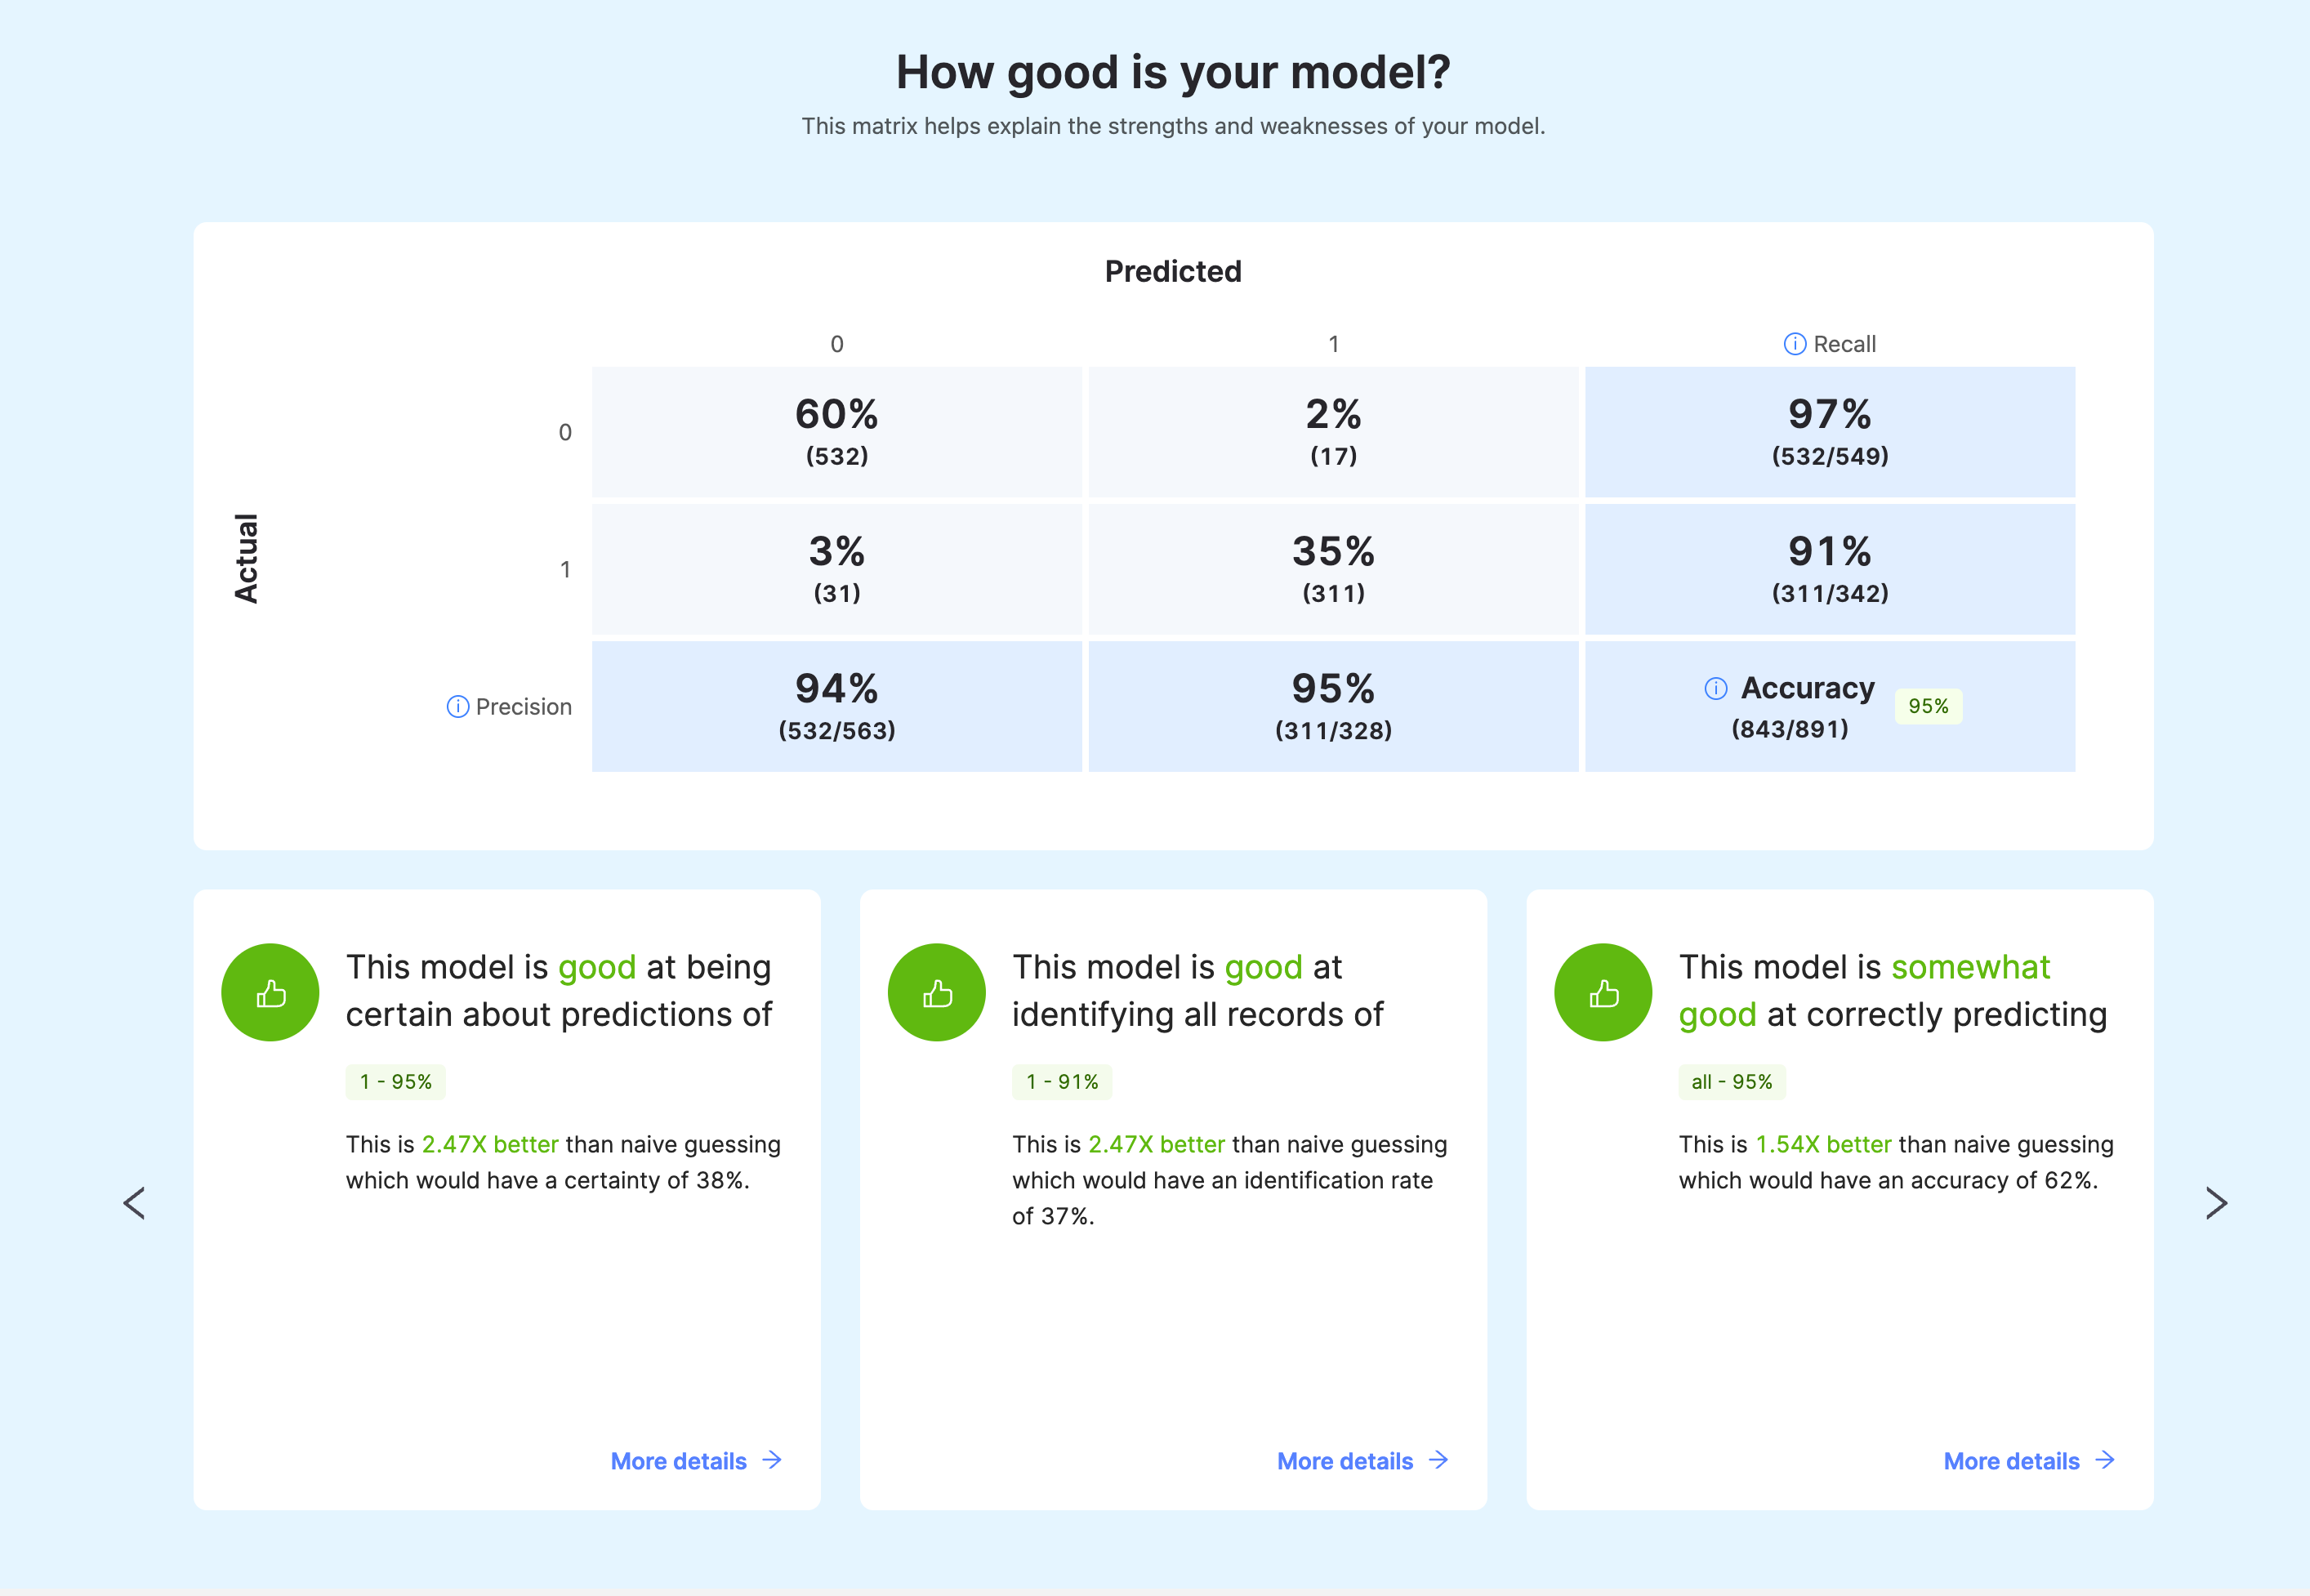
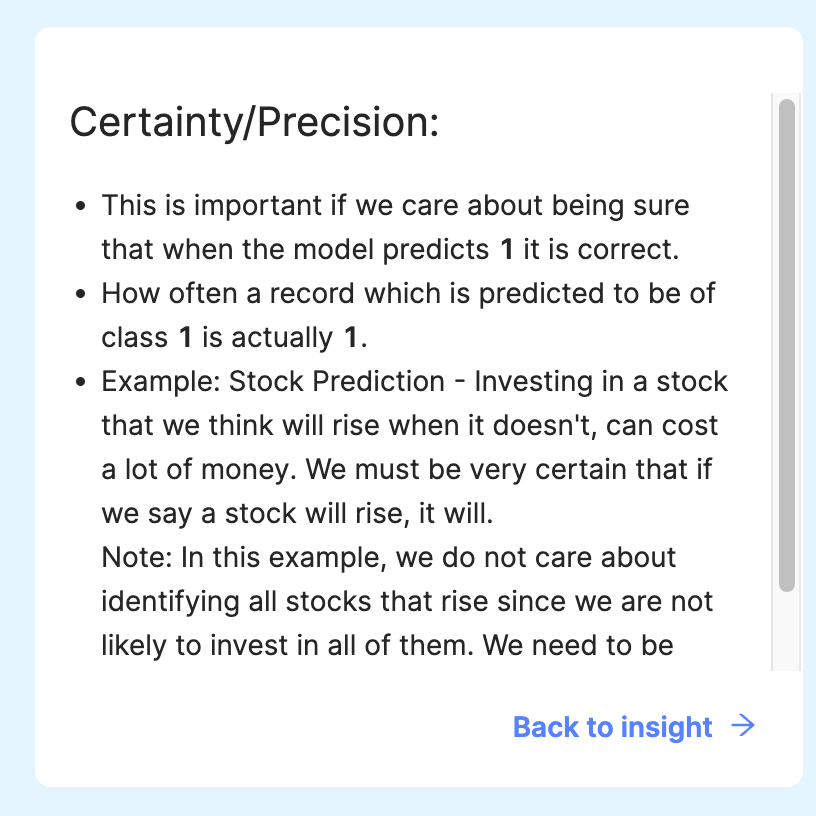
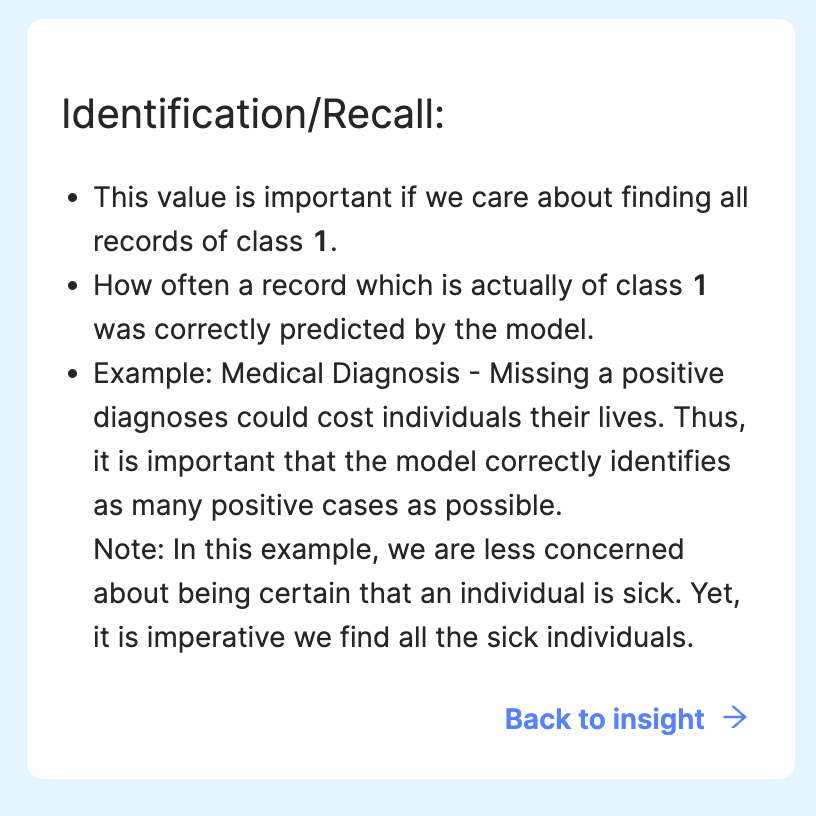
Here there are two things to trade off, Precision vs Recall. Precision is how often, if the model says a customer will churn, they do. Recall is how many of the customers that ended up churning did we correctly identify.
The cards above actually have some useful wording on explaining when and why you may care about each one if you click on more details:
Realistically these are measures you can use to compare to what action you plan to take with the model results and see if they make a good business plan. For example if as we said above a model gives you a 3 time better "recall" than random. And you wanted to offer a discount to "risky" customers to keep them from leaving, then you would need to ensure that the discount offered to the 97% of customers in that section who are unlikely to leave is outweighed by the income maintained by preventing some of the churners from leaving (usually this would depend on the organizations historic save rates)
some example calculations:
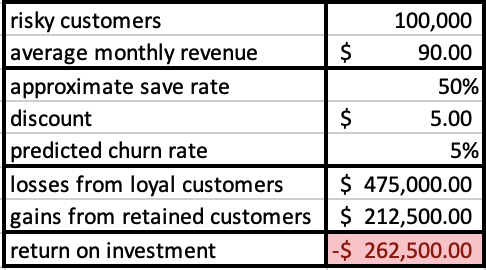
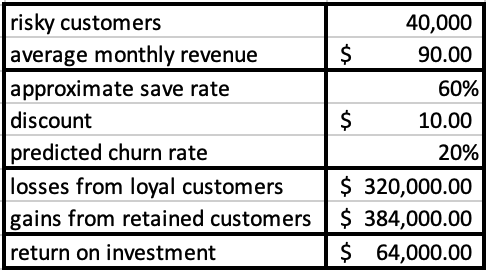
Here we see that this would be a very cash negative offer to provide. But if we were to restrict it to a smaller, but riskier customer group, by using the model to be more exact in our targeting, say only top 4%, and up the discount to increase the save rate, we could see something more useful:
In the end, how good a model is depends on how you intend to use it, but the data provided by the classifier/regressor tools helps you understand how good it is for you.
Always remember: "All models are wrong, some are just useful."