Adding charts to a dashboard from different pipes

I have created multiple charts on different pipes. How do I grab all of my charts and create one large dashboard?
Comments
-
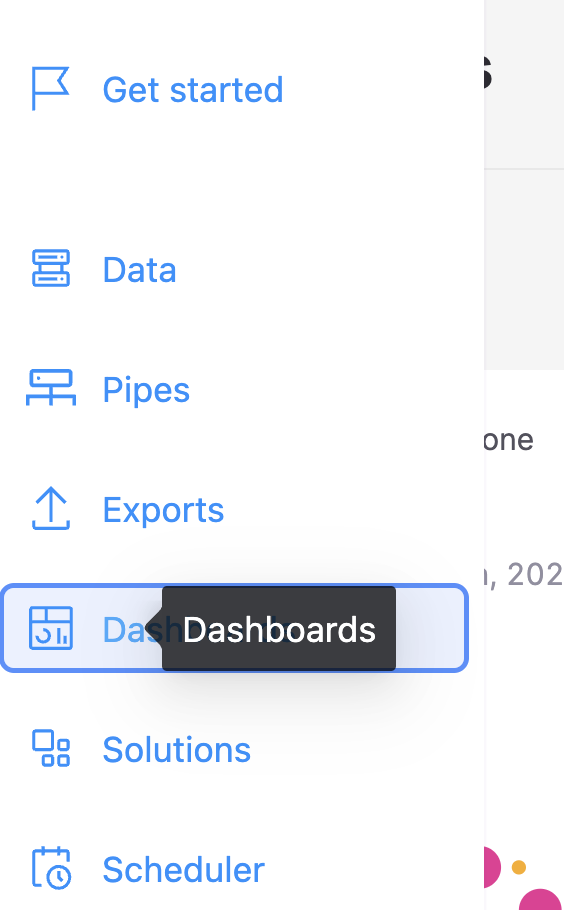
You can go to the dashboard tab from the left sidebar menu.
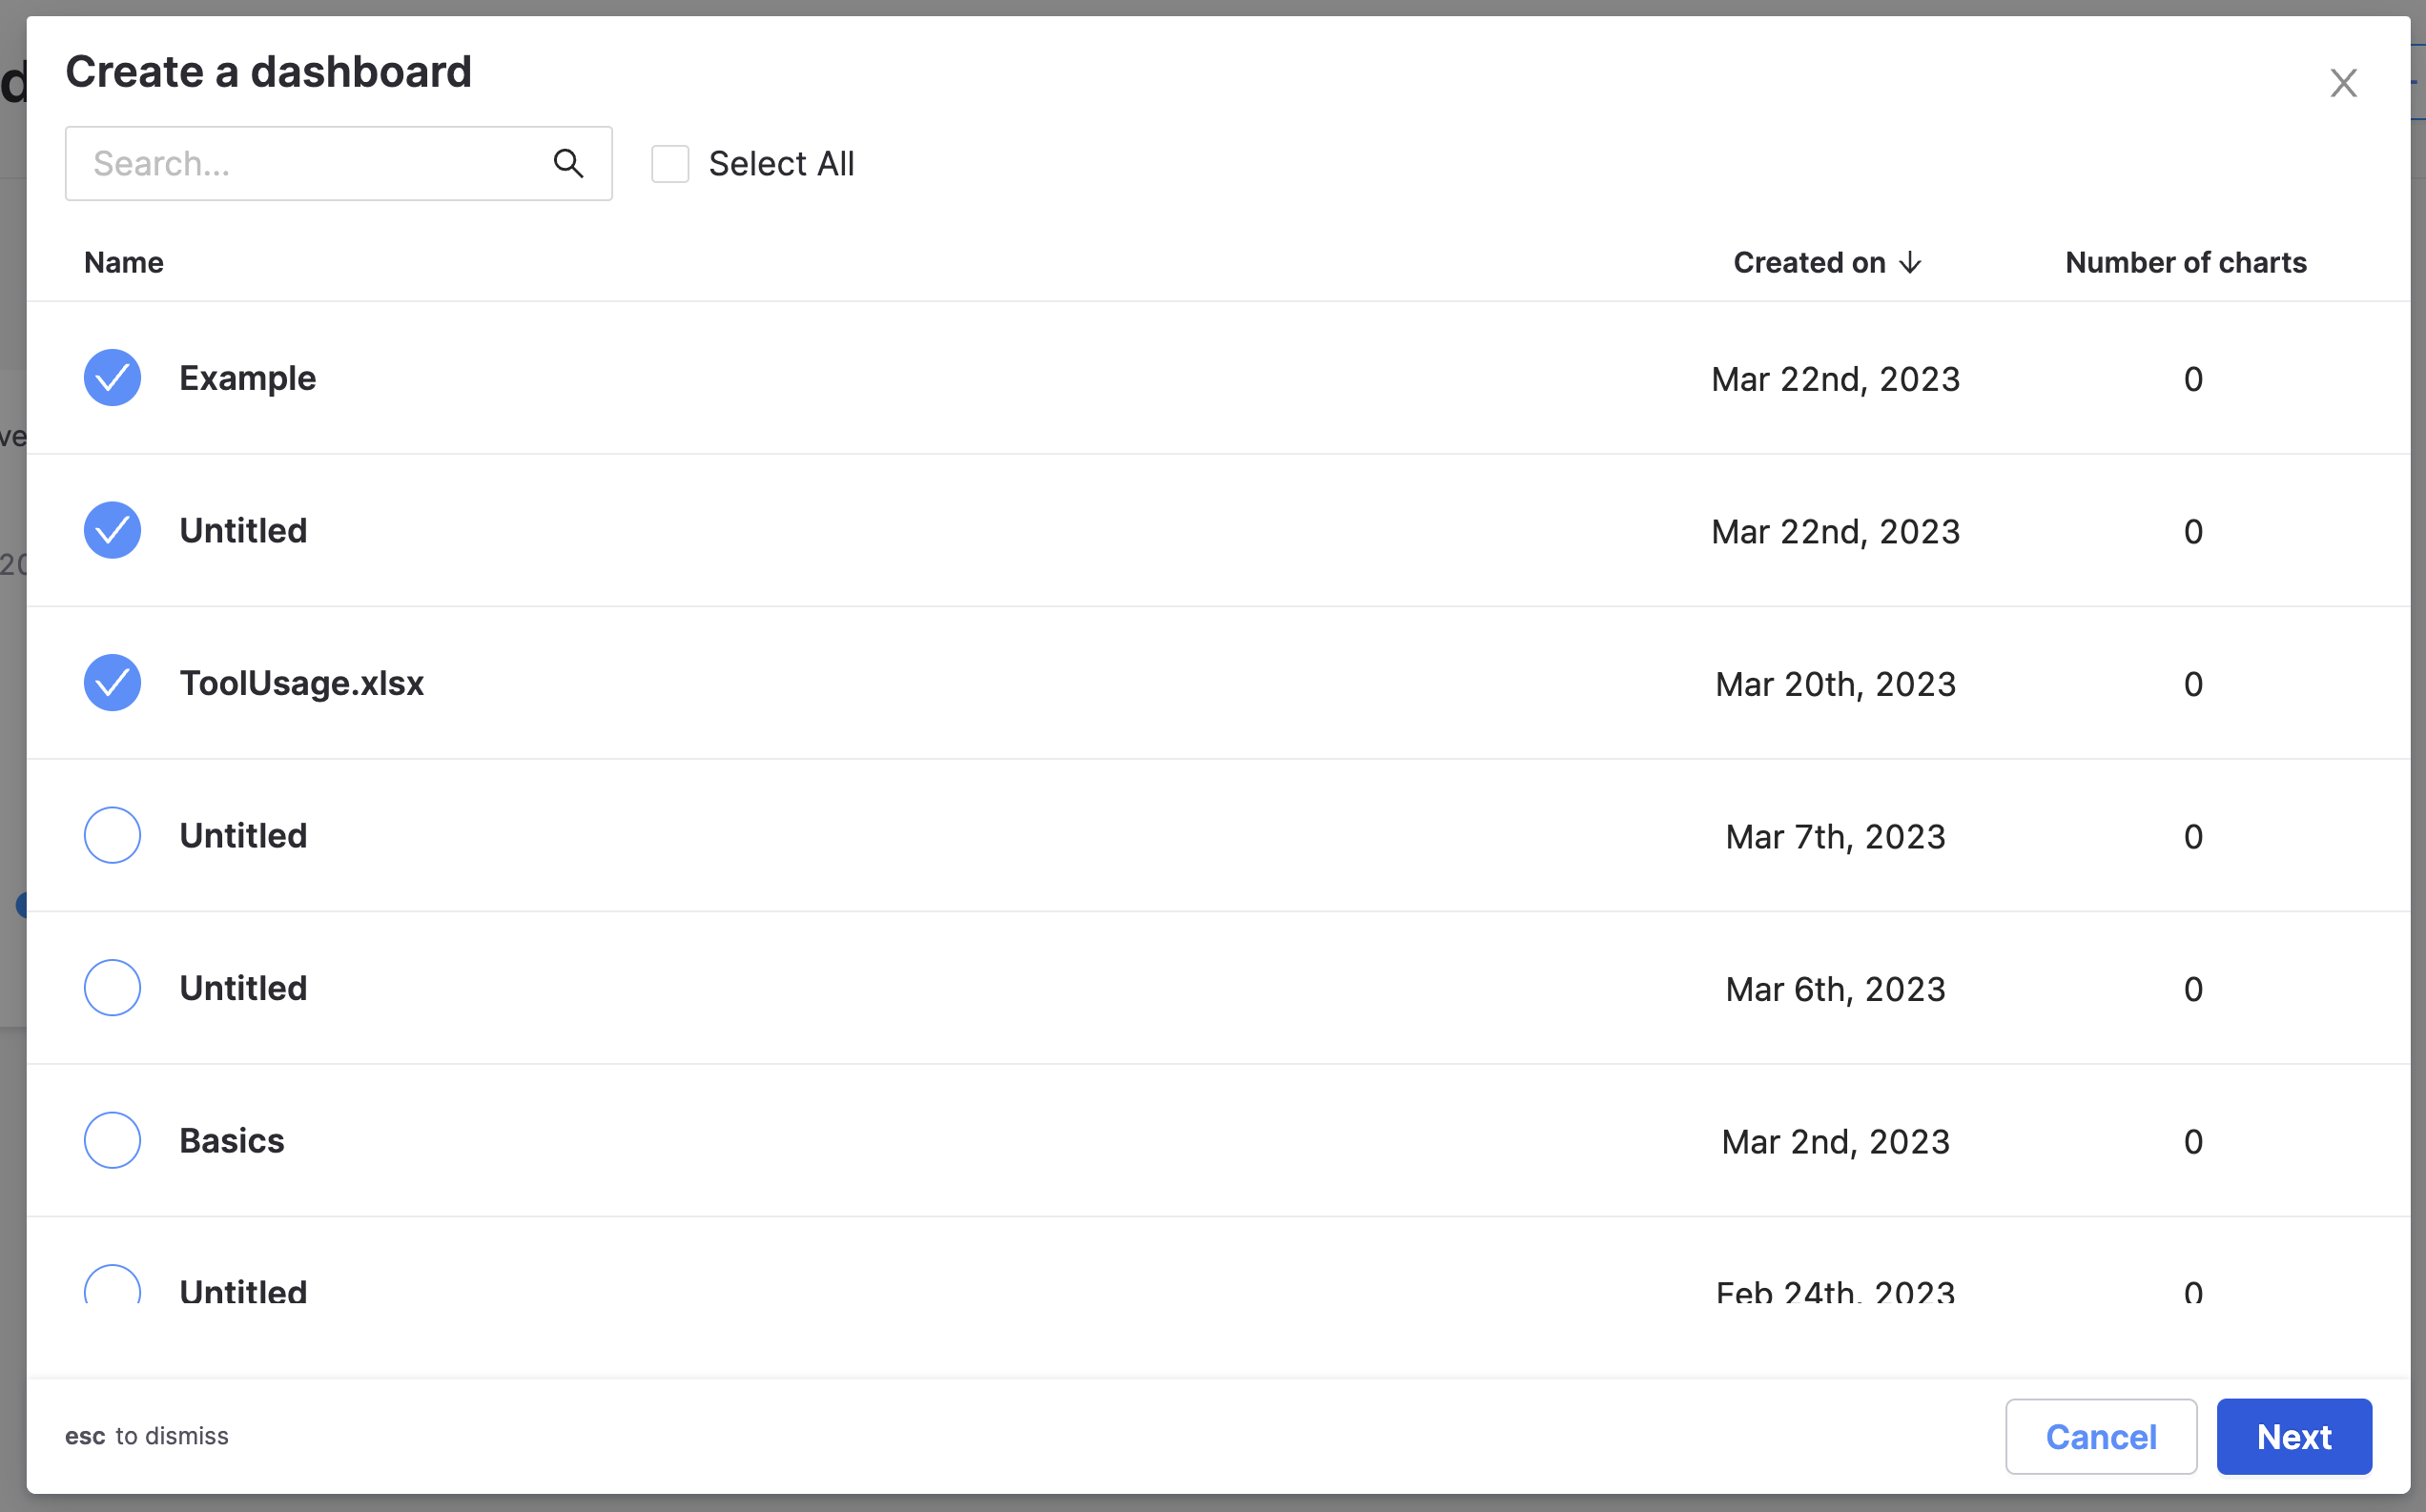
Create a dashboard

Multi-select the pipes you'd like to pull charts from. Then, click 'Next.'
Select the charts you'd like to add to your dashboard.
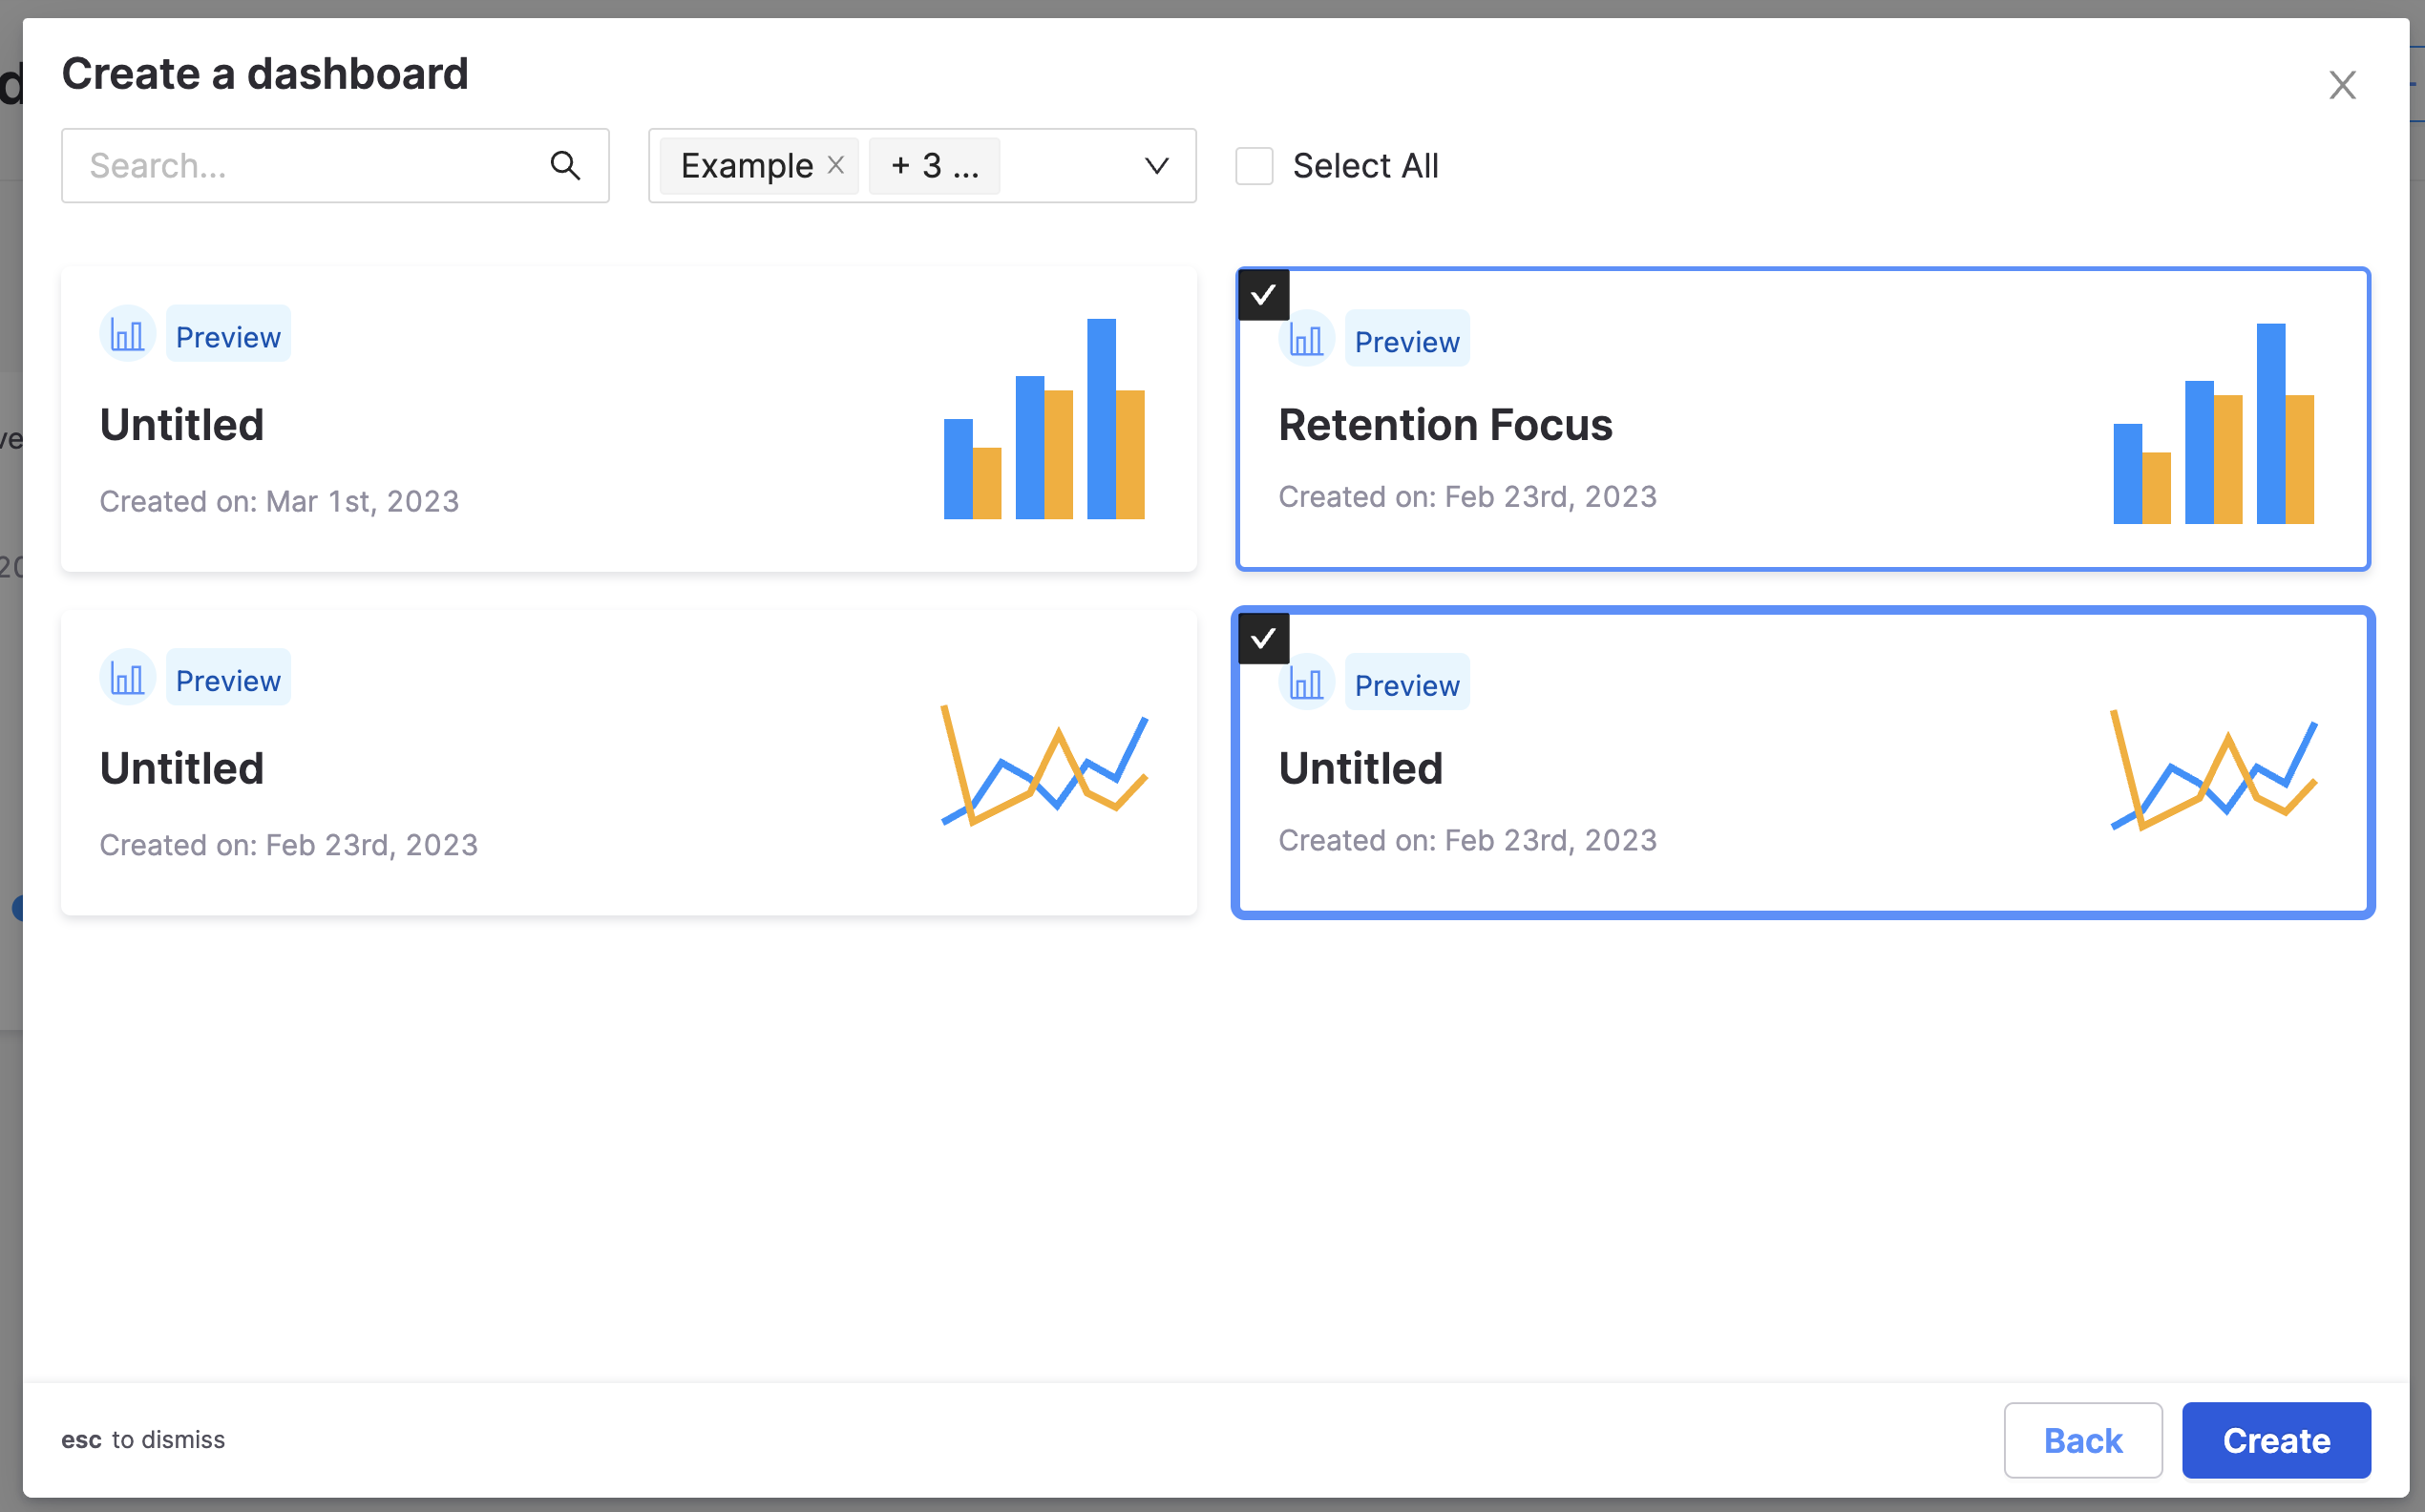
Next, look at your beautiful dashboard.